
Engage Budget 2019
Let’s build the budget together.
Update February 19, 2019 – The preliminary 2019 Operating and Capital budgets for the City of Winnipeg will be tabled at a special meeting of Executive Policy Committee on Friday March 1, 2019. For more information, see the budget 2019 webpage.
Want to know how the budget gets built? Check out our video to learn more.
2019 Budget engagement stats:
- 15 pop ups were held; one in each ward
- 600+ interactions with residents
- 850+ online surveys completed by the public (tool and traditional survey)
- One workshop with Winnipeggers
- Engage
- Timeline
- Background
- Documents
- FAQs
- Glossary
- Videos
- Related Links
Engage
Let’s build the budget together.
Sign up for Budget 2019 email updates to stay updated on the budget process.
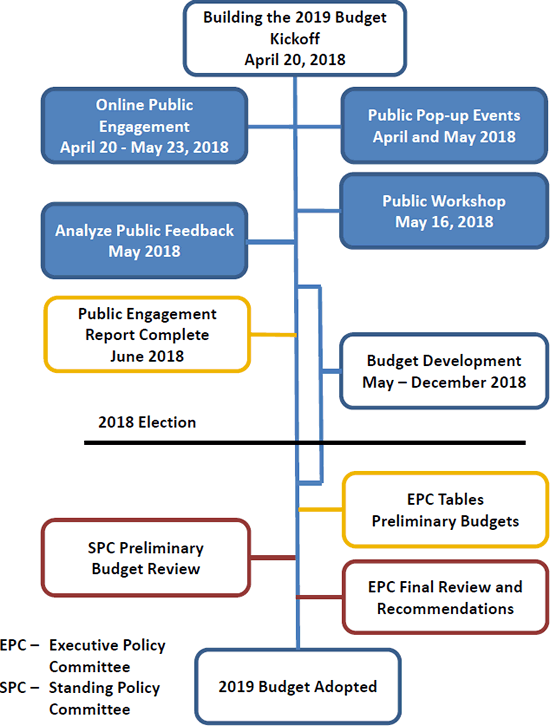
The 2018 budget consultations took place between April 24 and May 23, 2018. The public feedback gathered through this process will allow the City to develop a budget that reflects Winnipeggers’ priorities for key services and infrastructure while investing in the future of our city. Feedback was compiled into a Public Engagement Report to provide input in the budget development process. Please visit the Documents tab to view the full report and summaries.

Thank you to all who participated in the Budget 2019 public engagement. Public feedback will allow the City to develop a budget that reflects Winnipeggers’ priorities for key services and infrastructure while investing in the future of our city. Now that the public engagement program is complete, feedback will be compiled into a Public Engagement Report to provide input in the budget development process.
Last year, during the 2018 budget consultations, we received positive feedback on involving the public earlier in the budget process, and also heard that the public wanted more meaningful, in-person, and more straightforward online tools to provide feedback.
We learned from the 2018 budget engagement process and our public engagement goals for this year reflect your feedback:
- Engage citizens in the conversation about the infrastructure deficit and the need to begin taking action with the 2019 budget.
- Include a wide range of Winnipeggers from different perspectives and backgrounds in the conversation.
- Provide multiple mechanisms and opportunities to participate so everyone can find some way to contribute input.
If you would like to stay updated on City of Winnipeg public engagement events, follow the City on Facebook and Twitter, or sign up for the City of Winnipeg public engagement newsletter.
Background
The current City funding model is unsustainable. The City of Winnipeg is facing some difficult decisions following the first ever State of the Infrastructure Report. Facing a projected tax supported shortfall of $85.9 million and a $6.9 billion infrastructure deficit, the City must use every annual budget as a tool for change and more sustainable decisions.
The budget must strike a balance between current fiscal challenges and investment in services and infrastructure. The City is legally required to balance its budget under The City of Winnipeg Charter.
As the city keeps growing, demands on City services and infrastructure keep growing and outpacing the City’s ability to fund them adequately. A budget will be prepared that reflects citizens’ priorities for key services and infrastructure while investing in the future of our city. The 2019 budget will be built with Winnipeggers by identifying priorities and tradeoffs.
Because of population growth at historically high rates, demands are placing increasingly large pressures on both the operating and capital budgets to the extent that there is an unsustainable structural deficit in the tax-supported operating budget and a parallel infrastructure deficit in the capital budget.
On an annual basis, the Public Service prepares a 6-year capital investment plan as required by The City of Winnipeg Charter for Council-consideration, which includes the current year’s capital budget and a 5-year capital forecast. Additionally, 4-year longer-term capital projections are prepared by the Public Service for planning purposes.
Over the next 10 years (2018 – 2027), over $4.0 billion is estimated to go towards investments in the City’s infrastructure; however, that level of funding is not adequate to address the City’s infrastructure needs. The 2018 deficit is pegged at approximately $6.9 billion, with transportation services making up the majority of the overall deficit (70 percent). The deficit has identified a higher need to address existing infrastructure requirements compared to new infrastructure. This is due in part because many larger scale projects that are contemplated in the forecasted period are not currently funded.

Budget 2018
In 2017, the City engaged the public to find out their priorities before building the 2018 budget. The public’s input was reflected in the 2018 Budget as explained in the table below.
| Input | 2018 Budget Reflection of Priorities |
|---|---|
| Street Maintenance as the top priority service area in the public survey. | Investment of $116 million into local and regional road repair, the largest annual investment in Winnipeg’s history. |
| 42% of survey respondents indicated they think Winnipeg is facing both spending and revenue challenges. | Property tax increase of 2.33% (entirely dedicated to infrastructure) and tax-supported expenditure growth limited to 1.3%, one of the lowest increases in the history of Winnipeg. |
| Roadway construction and maintenance identified as top most important issue facing Winnipeg today. | The entire 2.33% property tax increase in 2018 is dedicated to infrastructure. |
| Transit was the second highest priorities service area in the public survey. | Keep transit fares amongst the lowest compared to other major cities, even with a 25 cent increase. Invests $28.4 million to purchase 40 new transit buses to modernize and renew the bus fleet |
| Active transportation was the third most important issue or concern facing our city today according to responses to the online survey. | Invests a record level $17.3 million into active transportation, a 31% increase from 2017. |
| Grants for poverty, community centres, and youth groups were the top three supported types of grants in the public survey. | Invests over $43 million in annual and multi-year grant funding to museums, community centres, and other community organizations. |
| Police Service selected as 7th highest priority service area in the public survey. Idea forum comments noted the importance of addressing salaries, overtime, and pensions for police. | The 2018 budget increases funding to police by 1.2%, in line with inflation. |
| Parks and Urban Forestry identified as the 8th highest priority service area in the public survey. | The 2018 capital budget invests a record $7.1 million in the Urban Forest Enhancement & Reforestation Capital Programs to help address Dutch Elm Disease. |
Documents
| Document Name | Date | Type |
|---|---|---|
| Canstar ad | 2018-04-24 | Advertisement |
| Pop-up Postcard | 2018-04-24 | Advertisement |
| Pop-up presentation boards | 2018-04-24 | Boards |
| 2018 Community Trends Performance Report Volume 1 | 2017-07-20 | Report |
| 2018 Preliminary Operating and Capital Budget Volume 2 | 2017-12-12 | Report |
| 2018 Adopted Capital Project Detail Volume 3 | 2017-12-12 | Report |
| Budget 2019 Public Engagement Report | 2018-07-20 | Report |
| Budget 2019 Public Engagement Summary | 2018-07-20 | Report |
| 2019 Community Trends and Performance Report - Volume 1 | 2018-07-20 | Report |
Frequently Asked Questions
The City budget is made up of two components: the operating budget and the capital budget. The capital budget represents a finite amount of money to be invested in specific projects. Examples of capital budget expenditures are road and bridge renewals, new facilities and facility upgrades and technology upgrades. The operating budget is where the money to keep things running on an on-going basis is represented. Examples of operating budget expenditures are labour costs, facility costs, and debt repayment.
Date added: April 24, 2018
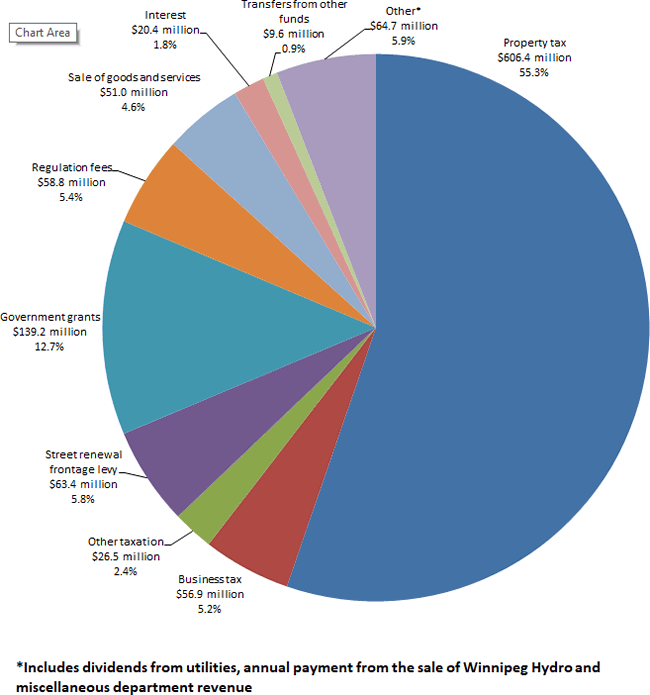
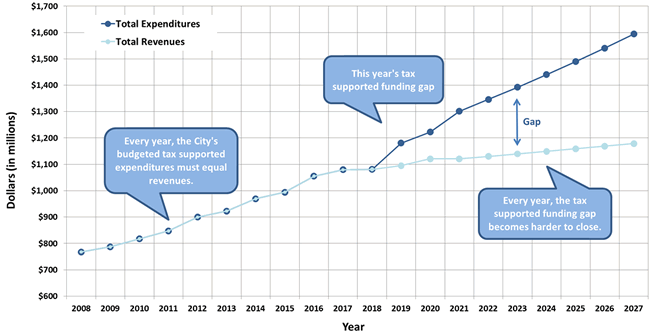
2019 Tax Supported Projected Revenues - $1,096.9 million
Date added: April 24, 2018
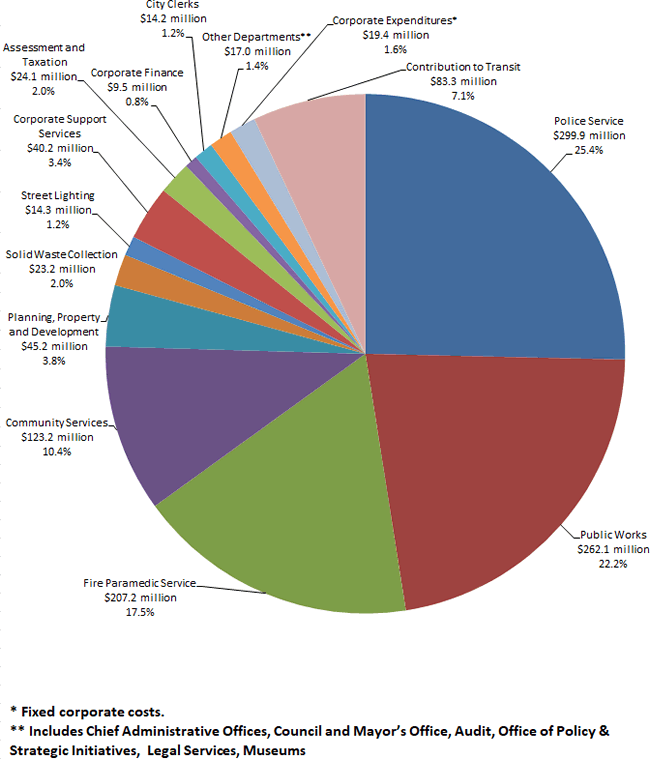
2019 Tax Supported Projected Expenditures - $1,182.8 million
Date added: April 24, 2018
The City is facing a projected tax supported shortfall of $85.9 million. The City is legally required to balance its budget and is not permitted to run a deficit under The City of Winnipeg Charter.
Date added: April 24, 2018
Budgetary challenges didn’t happen overnight. The increased demand on services, due largely to growth and other factors, has outpaced the City’s ability to fund them adequately.
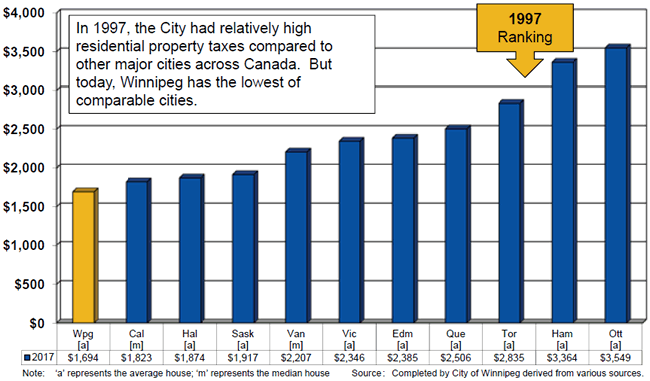
1997 - The City had comparably high residential property taxes relative to other Canadian cities.
1998 - The City began freezing property taxes (and therefore revenue received.)
1998-2011 - Property taxes were either cut or frozen. By the end of the period the City had an overall 6% property tax revenue reduction. But the city still grew and tax-supported expenditures continued increasing.
Over the last 15 years (1999-2017), other cities have continued to approve annual property tax increases for use for both their operating budgets and their capital/infrastructure budgets.
Cumulatively, these amount to significant increases relative to Winnipeg’s 11.3% property tax increases, as displayed in the table below.
| City | 1999 to 2009 | 2010 | 2011 | 2012 | 2013 | 2014 | 2015 | 2016 | 2017 | Increases Added 1999 to 2017 |
2018 |
|---|---|---|---|---|---|---|---|---|---|---|---|
| Vancouver | 43.7% | 2.0% | 2.0% | 2.8% | 2.0% | 1.9% | 2.4% | 2.3% | 2.0% | 63.0% | 4.24% |
| Edmonton | 50.1% | 5.0% | 3.9% | 5.4% | 3.3% | 4.9% | 5.7% | 3.4% | 3.4% | 84.6% | 3.2% |
| Calgary | 42.4% | 4.8% | 5.0% | 6.0% | 5.5% | 5.0% | 4.5% | 3.5% | 0.0% | 76.7% | 3.8% |
| Saskatoon | 37.1% | 3.9% | 4.0% | 4.0% | 5.0% | 7.4% | 5.3% | 3.96% | 3.9% | 73.3% | 4.7% |
| Regina | 23.6% | 4.0% | 4.0% | 3.9% | 4.5% | 5.9% | 3.9% | 3.3% | 4.2% | 59.6% | 4.3% |
| Winnipeg | -6.0% | 0.0% | 0.0% | 3.5% | 3.9% | 2.95% | 2.3% | 2.33% | 2.33% | 11.3% | 2.33% |
2017 Municipal Property Tax Comparison
Based on either average or median house values
Tax Supported Operating Budget - Forecast
In addition to the freeze on property taxes, the gap between forecasted tax supported expenditures and revenues is due to other factors, including:
- Population growth;
- Increasing costs of construction, and;
- Increasing costs of labour and staffing levels.
Date added: April 24, 2018
| Service | Per Year ($) | Per Month ($) | % of Total |
|---|---|---|---|
| Police Service | 528.33 | 44.03 | 30.5% |
| Fire Service | 255.37 | 21.28 | 14.7% |
| Road Maintenance | 155.98 | 13 | 9.0% |
| Public Transit | 141.91 | 11.83 | 8.2% |
| Organizational Support Service | 90.47 | 7.54 | 5.2% |
| Recreation | 86.27 | 7.19 | 5.0% |
| Parks and Urban Forestry | 73.16 | 6.1 | 4.2% |
| Roadway Snow Removal and Ice Clearing | 72.42 | 6.03 | 4.2% |
| Libraries | 61.16 | 5.1 | 3.5% |
| Solid Waste Collection | 45.35 | 3.78 | 2.6% |
| City Beautification | 36.57 | 3.05 | 2.1% |
| Council Services | 28.44 | 2.37 | 1.6% |
| Lighting | 28.44 | 2.37 | 1.6% |
| Assiniboine Park Conservancy | 28.13 | 2.34 | 1.6% |
| Medical Response | 24.23 | 2.02 | 1.4% |
| Remaining Arts, Ent & Culture | 17.57 | 1.46 | 1.0% |
| Insect Control | 14.92 | 1.24 | 0.9% |
| Assessment and Taxation | 14.5 | 1.21 | 0.8% |
| 311 Contact Centre | 9.92 | 0.83 | 0.6% |
| Community Liveability | 8.42 | 0.7 | 0.5% |
| Economic Development | 3.18 | 0.27 | 0.2% |
| Animal Services | 2.77 | 0.23 | 0.2% |
| City Planning, Insp & Housing | 2.75 | 0.23 | 0.2% |
| Cemeteries | 1.65 | 0.14 | 0.1% |
| Golf Services | 1.56 | 0.13 | 0.1% |
| City Property Tax Bill for Average House** | $1,733.47 | $144.46 | 100.00% |
| Street Maintenance Frontage Levy*** | $272.50 | $22.71 | |
| Total City Property Tax Bill for Average House | $2,005.97 | $167.16 | |
| *Street lighting originally included in Police Service is now disclosed separately. **Based on average home assessed at $296,560 in 2018. ***Based on $5.45 per frontage, on a 50 foot lot. |
|||
Date added: April 24, 2018
| Performance Measurements |
|
|---|---|
| Public Engagement |
|
| Budget Development |
|
| Table Preliminary Budgets |
|
| Committee Review |
|
| Council Approval |
|
Date added: April 24, 2018
Glossary
| Term | Definition |
|---|---|
| Expenditures | The amount of money the City spends on services, infrastructure and other expenses. |
| Revenues | The amount of money the City receives from taxes, levies, grants and other sources. |
| Surplus | The amount of money by which the City’s revenues exceed expenditures. |
| Deficit | The amount of money by which the City’s expenditures exceed revenues. |
| Shortfall | A projection of the amount of money by which budgeted expenditures exceed revenues. |
| Balanced Budget | A budget where expenditures and revenues are equal in a year. |
| State of the Infrastructure Report | A comprehensive report regarding the major asset groups that the City of Winnipeg (City) manages in order to deliver services for residents |
| Tax Supported Budget | The portion of the City’s budget which is funded through property taxes. |
| Capital Budget | The annual amount of money the City may spend on capital projects and investments, as determined by Council. |
| Operating Budget | The annual amount of money the City may spend on daily operating requirements, as determined by Council. |
| Executive Policy Committee | A committee that provides advice to Council on matters that affects the City as a whole, including policies, plans, budgets, bylaws. |
| Standing Policy Committee | A committee that provides advice to Council on specific matters.
Standing Policy Committees are:
|