Due to scheduled maintenance, the careers website will be unavailable from 4:30 p.m. Thursday, June 18 to 7 a.m. Monday, June 22. Job postings, career accounts, and access to the careers website through the employee portal will be unavailable during this time.

CSO Annual Results
On this page you will find annual summaries of:
- Combined sewer overflow (CSO) volumes, number of overflows, and what influenced them
- Updates on the City’s progress to reduce CSOs
- Historical overview CSO reporting
The complete results can be found in the City’s Open Data Portal. More information can be found within the CSO Annual Report.
Background
We have been working to reduce the amount and impact of CSOs in Winnipeg for many years. Winnipeg has 78 combined sewer outfalls. The outfalls are where the combined sewer releases wastewater into a water body as the system was designed to do. To see a map of the outfall locations and find out if there is any CSO activity in your area, visit MyUtilityInfo.
We submit data to the Federal and Provincial Governments in two Federal reports and one Provincial report on annual CSO discharges.
Results
In 2025, there were 1,015 combined sewer overflow (CSO) events with an estimated discharge of 8,820 ML. The annual CSO volumes and events are posted on the City’s Open Data Portal. Data values on this page are representative of the City’s sewer network model that was most up to date at the time of each reporting year.
The average number of overflows for each outfall in 2025 was 13 (1,015 events divided by 78 outfalls). Prior to 2013, CSOs were estimated to occur on an average of 22 times from each outfall.
This bar chart shows a snapshot of the CSO events and volume in megalitres (1 megalitre = 1 million litres).
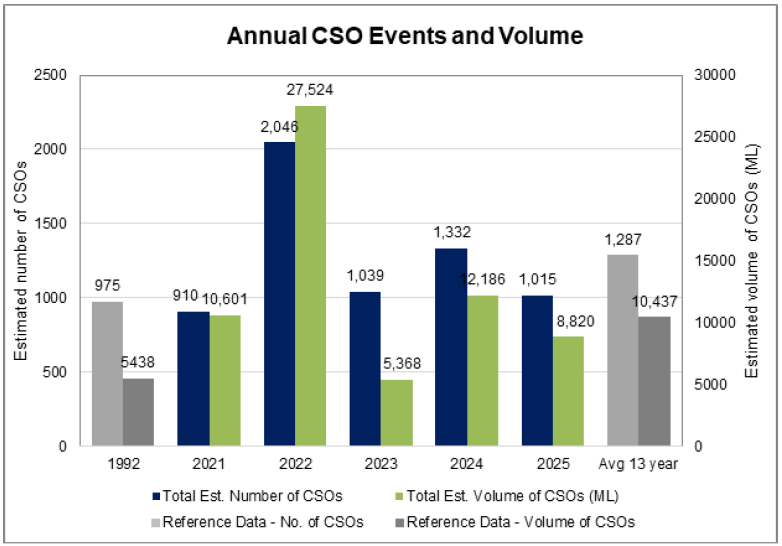
Graph description: The graph shows CSO events and volume for the last five years. The year 2022 had the highest CSO events and volume, 2,046 events and 27,524 megalitres. The year 2021 had the lowest number of events, 910, and 2023 had the lowest CSO volume, 5,368 megalitres. The graph also shows 1992 CSO results, 975 events and 5,438 megalitres. This is considered a representative year for Winnipeg rainfall and river conditions. Finally, the graph also shows the average CSO results for the past 13 years,1,287 events and 10,437 megalitres.
CSO volumes vary from year to year depending on several factors. The most critical relate to rainfall:
- The amount of rain that falls in the city
- The intensity, frequency, and duration of the rainfall
- Where the rain falls in the city
During years with increased rainfall events, it is expected that more CSOs will occur. This bar chart shows the total precipitation and the number of rainfall events that were greater than or equal to five millimeters.
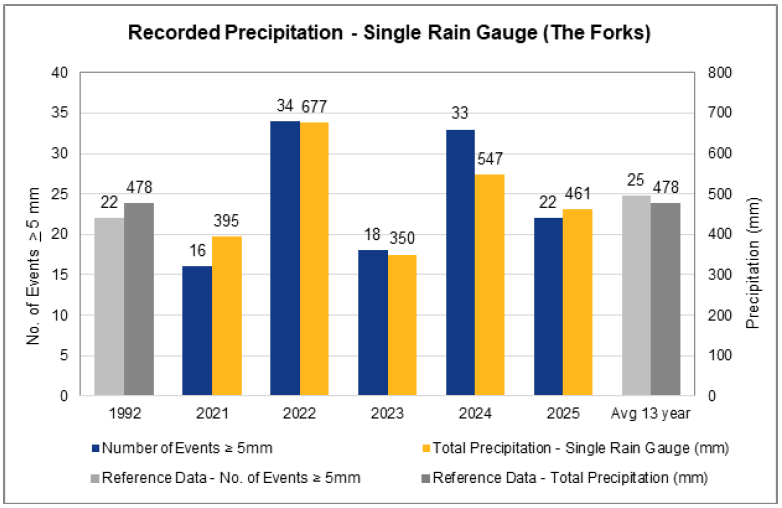
Graph description: This graph shows the number of rainfall events with precipitation over five millimetres and the total amount of precipitation. In 2025, there were 22 rainfall events and 461 mm of precipitation. The year 2022 had the highest number of rainfall events and precipitation, with 34 events and 677 mm. The year 2021 had the lowest number of rainfall events, 16, and 2023 had the lowest precipitation, 350 mm. In the 1992 representative year, there were 22 events and 478 mm of precipitation. The 13-year average is 25 events and 478 mm of precipitation.
The intensity and frequency of rainfall events will affect both the volumes of the wastewater treated and the makeup of the wastewater arriving at the plant.
We completed a historic review of significant rainfall events and found that CSO volume contains approximately four percent wastewater and 96 percent rainfall runoff. The bar chart below shows the last five years and the 13-year average of total treated wastewater and CSO volume breakdown using the four percent value for the wastewater component.
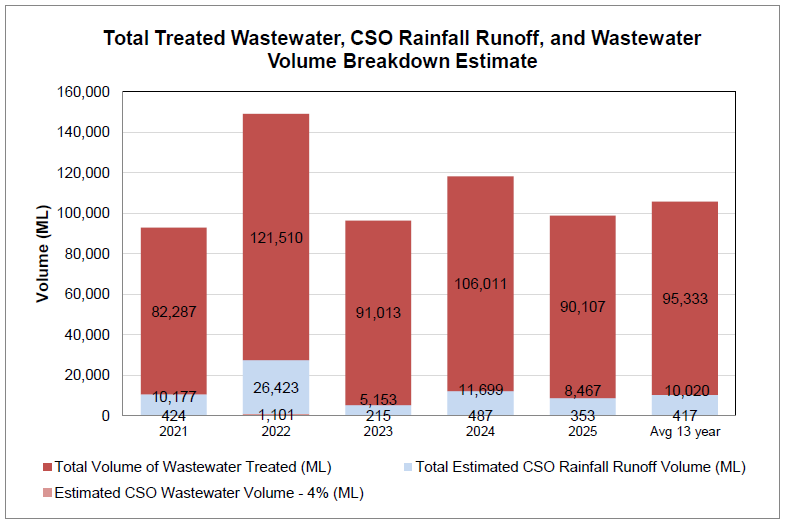
Graph description: This bar chart shows that the year 2022 had the highest total treated wastewater with 121,510 megalitres. This year also had the highest estimated CSO rainfall runoff volume of 26,423 megalitres and estimated CSO wastewater volume of 1,101 megalitres. The year 2025 had 90,107 megalitres of total treated wastewater, 8,467 megalitres of CSO rainfall runoff volume, and 353 megalitres of CSO wastewater volume. The 13-year average resulted in 95,333 megalitres of total treated wastewater, 10,020 megalitres of CSO rainfall runoff, and 417 megalitres of CSO wastewater volume.
Progress Updates
In 2025, we committed $54 million towards new contracts, as directed by the CSO Master Plan. This is the highest annual commitment in the program's history. The new commitments include contracts in the following areas:
Since the CSO Master Plan commenced in 2019, we have committed a total of $177 million. You can find more information on the progress of the CSO Master Plan through our annual reports.
In addition to the CSO Master Plan projects, we also invested over $14.7 million invested on outfall infrastructure rehabilitation projects, since 2013, which helps reduce CSO volumes and frequency by maintaining City infrastructure.
CSO reporting timeline
Below you will find our CSO reporting timeline.
1999 - 2002:
- As required by the Canadian Environmental Protection Act, and as part of the National Pollutant Release Inventory (NPRI), we began to report on estimated sewage loss from our combined sewer network.
- We had to use analytical assumptions for our estimates. This is due to the lack of instrumentation at any of our combined sewer outfalls.
2003:
- The Clean Environment Commission (CEC) recommends that we instrument the combined sewer outfalls.
2008:
- We started developing the Combined Sewer Outfall Monitoring Program. This program outlines how we will install instrumentation at combined sewer outfalls.
2009-2016:
- We began implementing the Combined Sewer Outfall Monitoring Program. We invested over $12 million in outfall monitoring and volume calculation tools to improve CSO estimates. This includes 39 outfall locations instrumented for CSO monitoring.
- With the new instruments, we designed a hydraulic model of the combined sewer outfall districts. We were then able to confirm model estimation based on observed data. This marked the first time we were able to provide reliable estimations of CSO events and volume.
- In 2015, we estimated and validated overflows for 39 outfalls, using installed instruments. In 2016, we estimated overflows for all CSO outfalls using a single hydraulic model.
2013:
- The Federal Wastewater System Effluent Regulations (WSER) directs the City to:
- Keep CSO records starting in 2013
- Provide annual CSO Reporting due February 15 each year after
- Our Province Environment Act Licence No. 3042 also required annual reporting of CSO to start in 2014. We began providing estimates of CSO volumes from some of the outfalls.
2014:
- We began submitting CSO discharge data for these three reports:
2015:
- The CSO Master Plan Preliminary Proposal was submitted to the Province on December 18, 2015. It recommended an 85 percent CSO volume capture long-term control plan.
2017:
- On November 24, 2017, the Province of Manitoba directed the us to complete the next phase of the CSO Master Plan by August 2019. The Master Plan was to use an 85 percent CSO volume capture in a representative year.
2019:
- The CSO Master Plan was submitted to the Province on August 28, 2019. It included conceptual plans to meet the approved control of 85% CSO volume capture in a representative year for 43 combined sewer districts by December 31, 2045. On November 13, 2019, the Province of Manitoba approved the City’s CSO Master Plan.
2020-2022:
- We installed instrumentation to seven more outfalls. This increased the total of CSO outfalls monitored from 39 to 46. Our wastewater flow estimates from CSOs are now validated with instrumentation at 46 CSO outfall locations.
2025:
- The CSO locations increased from 76 to 78. Two new overflow points were identified and added to the CSO reporting.