
Combined Sewer Overflow (CSO) Annual Results
- Background
- Performance Updates
- Results
- Timeline
- CSO Outfall Locations
Like many cities in North America, Winnipeg has a combined sewer system. Combined sewers are designed to collect both land drainage (rainwater and snowmelt) and wastewater (sewage from homes and businesses) in the same pipe, and transport both to the sewage treatment plant before being released into the river. However, in large wet weather events, the sewers can get overloaded with excess rainwater causing the contents of the combined sewers to overflow into the rivers, as per the design intent.
The CSO Master Plan will work to reduce the effects of CSOs on our waterways by increasing the amount of combined sewer flow that is treated at our sewage treatment plants before being released into the river. The plan is designed to take the 2013 baseline sewer system from collecting about 74 percent of the combined sewer flows and treating it, to collecting and treating 85 percent by 2045.
Since 2019, the City has committed approximately $109 million towards the CSO Master Plan. From 2009 to 2017, the City invested over $12 million in CSO outfall monitoring and volume calculation tools to improve CSO estimates. This decision was the result of a recommendation from the Clean Environment Commission. Prior to the installation of these instruments, estimates were based only on analytical data using a variety of assumptions.
As a result of the instrumentation investments:
- The City began providing estimates of CSO volumes from a portion of the outfalls in 2013
- Overflows were estimated for 39 outfalls, which were validated with installed instruments as of 2015
- Overflows were estimated for all CSO outfalls using a single hydraulic model as of 2016
The City has spent over $14 million from 2013 to 2024 for outfall and gate chamber rehabilitation projects. Additional instrumentation has been added to seven outfalls since 2020, increasing the total monitored CSO outfalls to 46.
Prior to 2013, CSOs were estimated to occur an average of 22 times from each outfall. In 2024, the average number of overflows for each outfall was 18 (1,332/76 = 18). This is primarily based on the validated CSO results.
This bar chart shows the total precipitation and the number of significant rainfall events greater than or equal to five millimeters per year.
Annual and Average 10-Year Rainfall for the Combined Sewer Area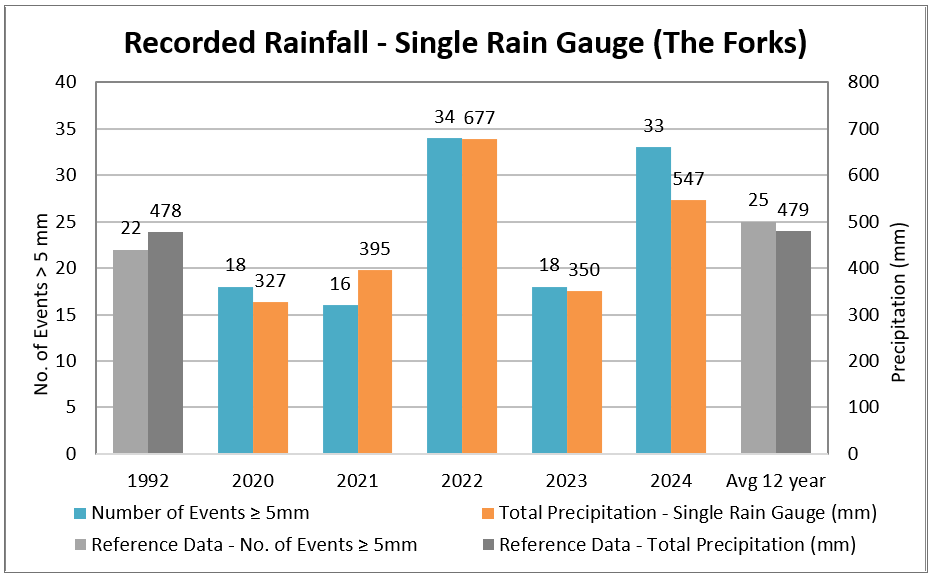
This bar chart shows the number of CSOs per year along with the volume of overflow per year.
Annual and Average 11-Year CSO Events and Volume 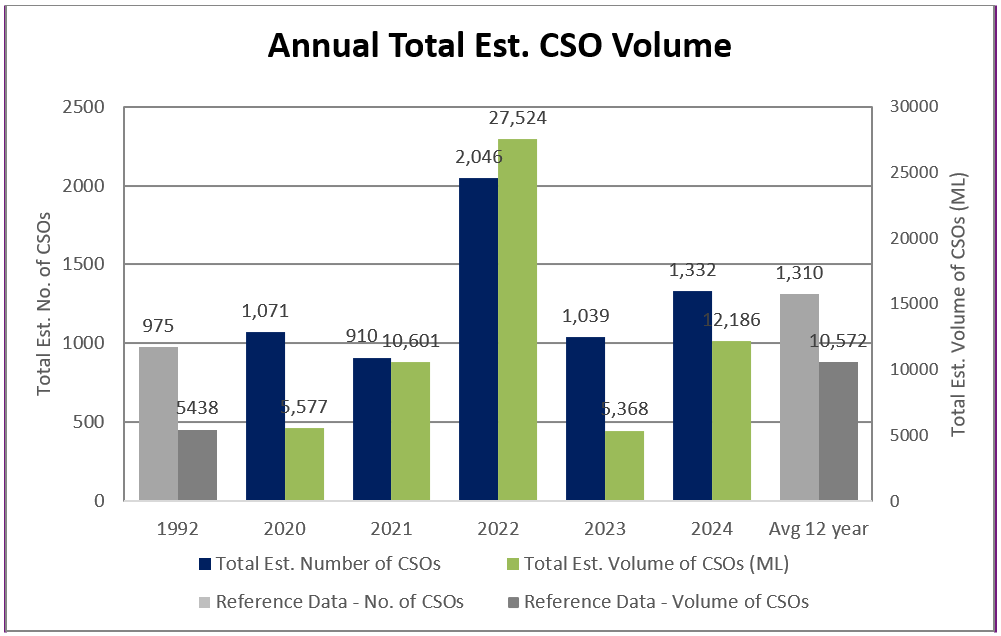
CSO volumes vary from year to year depending on a number of factors. The most critical are: the amount of rain that falls in the city, the intensity, frequency and duration of the rainfall, and where it falls in the city. These factors and river levels can greatly influence the volume of sewage during an overflow event.
The amount of wastewater that is treated at our sewage treatment plants will vary based on the intensity and frequency of wet weather events. Using an example from a previous review of historic significant rainfall events, one event was assessed in detail and showed that four percent of the CSO was wastewater and 96 percent was rainfall runoff. The bar chart below illustrates the total treated wastewater and CSO volume breakdown using the four percent value for the wastewater component. The bar chart shows the annual and average 11-year values where one megalitre (ML) equals 1,000,000 litres.
Annual and Average 11-Year Total Treated Wastewater, CSO Rainfall Runoff and Wastewater Volume Breakdown Estimate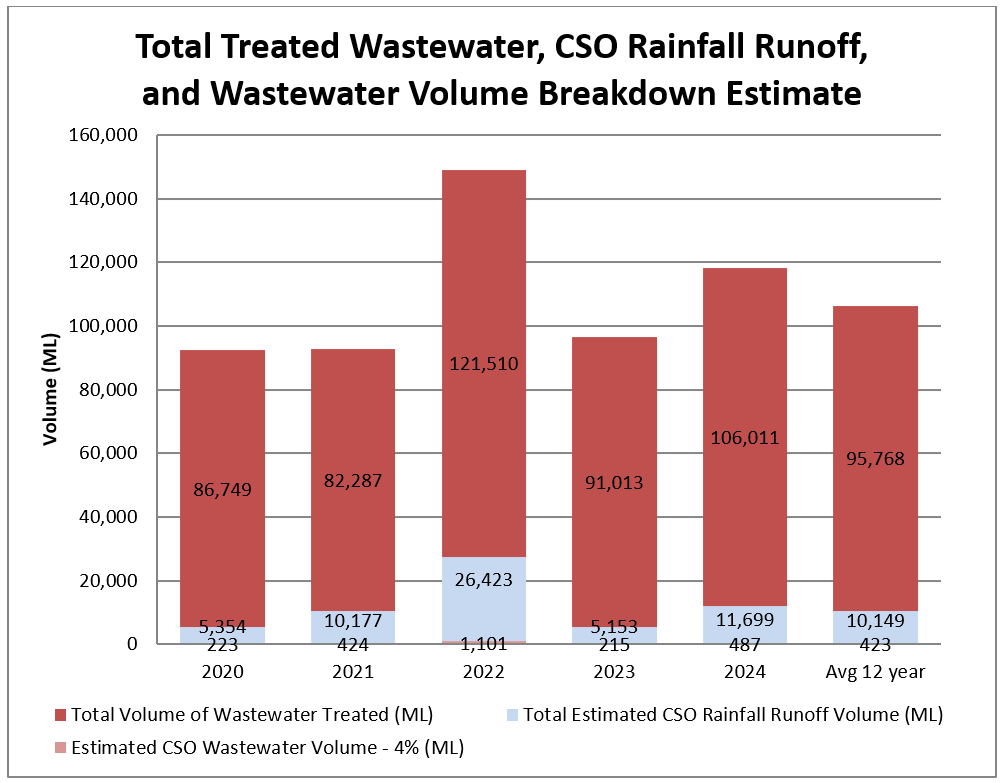
The City of Winnipeg has been working to reduce the amount and impact of CSOs in Winnipeg for many years. This work is very expensive and takes time. You can learn more about CSOs by visiting Winnipeg.ca/cso.
Data values on this page are representative of the Sewer Network model that was most up-to-date at the time of each reporting year.
Results
2024
2023
2022
2021
2020
2019
2018
2017
2016
2015
2014
2013
Timeline
1999
Federal Government required reporting on estimated sewerage lost from the sewer network under the Canadian Environmental Protection Act, 1999 as part of the National Pollutant Release Inventory (NPRI).
2000 - 2002
National Pollutant Release Inventory (NPRI) report estimation of percent sewerage volume lost from CSOs was based on purely analytical assumptions as no permanent CSO outfall instrumentation was in place.
2003
A recommendation from the Clean Environment Commission (CEC) was to instrument the CSO outfalls.
2008
Planning began on the CSO Outfall Monitoring Program for installing instrumentation at CSO outfall sites. From 2009 to 2015, 39 outfall locations have been instrumented for CSO monitoring. The cost of the CSO monitoring equipment and hydraulic models necessary to measure and estimate CSO volumes is approximately $12 million.
2013
In 2013, a hydraulic model of the instrumented CSO outfall districts was developed and calibrated based on the instrumentation. This allowed for model estimation to be validated based on observed data. This proof of concept work allowed for reliable validated estimation of CSO event and volume for the first time.
Federal Wastewater System Effluent Regulations (WSER) mandated the City to keep CSO records from 2013 and provide annual CSO Reporting due February 15 each subsequent year.
Province Environment Act Licence No. 3042 required annual reporting of CSO to commence in 2014.
Since 2013
Estimates of wastewater flows from CSOs have been validated based on instruments installed at 39 CSO Outfall locations.
Since 2014
The Department submits CSO discharge data in two Federal reports and one Provincial report on annual CSO discharges: National Pollutant Release Inventory (NPRI) report, Wastewater System Effluent Regulations (WSER) report, and Environment Act Licence No. (EAL No. 3042)
2015
The CSO MP Preliminary Proposal was submitted to the Province on December 18, 2015 recommending an 85% CSO volume capture long term control plan.
2017
On November 24, 2017 the Manitoba Government directed the City to complete the next phase of the CSO Master Plan by August 2019 with a recommended control of 85% capture in a representative year.
2019
The CSO Master Plan was submitted to the Province on August 28, 2019, consisting of conceptual plans to meet the approved control of 85 percent capture in a representative year for 43 combined sewer districts by December 31, 2045.
On November 13, 2019 the Manitoba Government approved the City’s CSO Master Plan.
2020
Estimates of wastewater flows from CSOs at instrumented CSO Outfall locations increased from 39 to 42.
2021
Estimates of wastewater flows from CSOs at instrumented CSO Outfall locations increased from 42 to 45.
2022
Estimates of wastewater flows from CSOs at instrumented CSO Outfall locations increased from 45 to 46.